Stopping Power for Light and Heavier Ions
Graphs, Data, Comments and Programs
This page will never be
finished, but I keep trying!
Last
update: 16 Oct 2015 (see bottom of page)
My name
is Helmut Paul (b. 1929). Since 1990, I have been collecting
data on stopping powers for light ions, while my colleagues at the University
of Linz measured them. I plotted the data versus energy/nucleon, compared  them to each other and to the
theoretical or semi-empirical curves available in the literature. Together with
A. Schinner, I produced a program MSTAR that will predict stopping powers for
ions from 3Li to 18Ar (most recent version 3.12 of 2004).
Our program JUDGE is used to compare stopping tables and experimental data in a
statistical manner (see, e.g., papers below).
them to each other and to the
theoretical or semi-empirical curves available in the literature. Together with
A. Schinner, I produced a program MSTAR that will predict stopping powers for
ions from 3Li to 18Ar (most recent version 3.12 of 2004).
Our program JUDGE is used to compare stopping tables and experimental data in a
statistical manner (see, e.g., papers below).
In recent years, the
collection has been enlarged to include also all ions. It treats the electronic
stopping power (we assume that “nuclear” stopping has been subtracted, but
that need not always be true). It considers ordinary cold matter, not the
plasma state. It considers gases and amorphous or polycrystalline solids.
Graphs are only shown where at least two
or three data files are available for the particular ion and target, but
all available experimental data are given in the data
collection.
You are welcome to look at the plots, to use the data collection and to use
program MSTAR. Although my collection is large, it is probably not complete. I
keep it up to date, hoping that another expert (who??) will take over before I
have to give up.
Since 2009, tables of Optical
Oscillator Strengths have been listed for several elements, see below.
For recent discussions of stopping power data
and of some related tables and programs, see papers by H.
Paul and co-authors:
"An empirical approach to the
stopping power of solids and gases for ions from Li to Ar",
Nucl. Instr.
Methods Phys. Res. B 179 (2001) 299,
"An empirical approach to the stopping
power of solids and gases for ions from Li to Ar, Part II",
Nucl. Instr. Methods Phys. Res. B 195 (2002) 166,
"Judging the reliability of stopping power
tables and programs for heavy ions",
Nucl. Instr. Methods Phys. Res. B 209 (2003) 252,
"Empirical stopping power tables for ions
from 3Li to 18Ar and from 0.001 to 1000 MeV/nucleon in
solids and gases",
Atomic Data and Nuclear Data
Tables 85 (2003) 377.
"Judging the reliability of
stopping power tables and programs for protons and alpha particles using
statistical methods",
Nucl. Instrum.
Methods. Phys. Res. B 227 (2005) 461
R.Bimbot, H.Geissel, H.Paul, A.Schinner, and P. Sigmund: “ICRU Report 73: Stopping of Ions Heavier Than
Helium”;
J. of the ICRU 5, No.1 (2005)
“A comparison of recent stopping power tables
for light and medium-heavy ions with experimental data, and applications to
radiotherapy dosimetry",
Nucl. Instrum.
Methods Phys. Res. B 247 (2006) 166
"Statistical analysis of stopping data for
protons and alphas in compounds",
Nucl. Instrum. Methods Phys. Res. B 249 (2006) 1
"New developments in stopping power for
fast ions",
Nucl. Instrum. Methods Phys. Res. B 261 (2007) 1176
"Some new results on stopping power for
fast ions",
A.I.P. Conf. Proceedings 1099
(2009) 251
P.Sigmund, A.Schinner and H.Paul: "Errata and Addenda for ICRU Report 73,
Stopping of Ions Heavier than Helium",
J. of the ICRU (Oct. 8, 2009)
"Recent results in stopping power for
positive ions, and some critical comments",
Nucl. Instrum.
Methods Phys. Res. B 268 (2010) 3421
H. Paul, “The stopping Power of Matter for Positive Ions”. In: Modern
Practices in Radiation Therapy, ch. 7, G.Natanasabapathi (Ed.), InTech, ISBN
978-953-51-0427-8 (2012), available from http ://www.intechopen.com/books/modern-practices-in-radiation-therapy
Helmut Paul, "New
results about stopping power for positive ions: Experiment and theory”,
AIP Conf. Proc. 1525 (2013) 295
Helmut Paul and Daniel Sánchez-Parcerisa: “Acritical overview of
recent stopping power programs for positive ions in solid elements”
Nucl. Instr. Methods in Phys. Res. B 312 (2013) 110
Particular aspects of stopping power are
discussed in the following papers:
Helmut Paul: ”A note on the Density Effect in the Stopping
Power for positive Ions",
Nucl. Instr. Methods Phys. Res.
B 217 (2004) 7
H.Paul and A.Schinner: "Does the Result of a Stopping Power
Measurement Depend on the Method Used?",
Physica Scripta 69 (2004) C41
Helmut Paul: "On the Gas-Solid Difference in
Stopping Power for low Energy Ions",
Nucl. Instr. Methods Phys. Res.
B 262 (2007) 13
Helmut Paul: "Erratum to 'On the Gas-Solid
Difference in Stopping Power for low Energy Ions'",
Nucl. Instr. Methods Phys. Res.
B 266 (2008) 857
Helmut Paul: "The Solid-Gas Difference in
Stopping Powers, and Statistical Analysis of Stopping Power Data",
Nucl. Instr.
and Meth. in Phys. Res. B 267 (2009) 9
H.Paul, P.L.Grande, D.Y.Smith: "Optical Oscillator Strengths, Mean
Excitation Energy, Shell Corrections and experimental values for Stopping
Power",
Nucl. Instr.
and Meth. in Phys. Res. B 267 (2009) 2471
Helmut Paul: “Nuclear stopping
power and its impact on the determination of electronic stopping power”,
AIP Conf. Proc. 1525 (2013)
309
Helmut Paul and Daniel Sánchez-Parcerisa: “Acritical overview of
recent stopping power programs for positive ions in solid elements”
Nucl. Instr. Methods in
Phys. Res. B 312 (2013) 110
Applications to
radiation therapy are discussed in the papers:
H.Paul, O.Geithner,O.Jaekel: "The ratio of stopping powers of water and
air for dosimetry applications in tumor therapy"
Nucl. Instrum.
Methods Phys. Res. B 256 (2007) 561
H.Paul, O.Geithner,O.Jaekel: "The Influence of Stopping Powers upon
Dosimetry for Radiation Therapy with Energetic Ions"
Adv. Quantum Chem. 52 (2007)
289
H.Paul: "The mean ionization potential of
water,and its connection to the range of energetic carbon ions in water",
Nucl. Instrum.
Methods Phys. Res. B 255 (2007) 435
H.Paul: "On the I values for Liquid Water
used in ICRU Reports 49 and 73",
ICRU News 2007 #1
H.Paul: “On the Accuracy of Stopping Power Codes and Ion Ranges used for Hadron
Therapy”, pp. 39-61 in
“Theory of Heavy Ion
Collision Physics in Hadron Therapy”, D. Belkic, ed., Elsevier/Academic Press
(2013), ISBN 978-0-12-396455-7
Introduction
to Graphs and Data
- Do you want to see an example of a picture ? The gif-picture shows the measured stopping power data for carbon ions in aluminum from many different sources. Every symbol corresponds to a data point; the different letters correspond to different publications. The various curves correspond to different fitted semi-empirical curves from the literature. To save or print, right-click on the picture.
- If you can use the program Microcal Origin to view one of my *.org files, you are much better off: not only do you get a better view of the graph, but you may also change the scales to suit your interest, and you may view the numerical data (measured points and curves) themselves. As an example, try the file 12CAl.org that corresponds to the picture shown above. Click here to save the compressed version of the file to your disk. You can also save the file to disk by pointing to the underlined word and using Save Link As. Then decompress (unzip) the file with a suitable program, and open using Origin. If you have difficulties, please tell me (address below).
- The stopping power shown in the graphs is
the electronic stopping power. The stopping power due to collisions
between projectile and an entire atom ("nuclear" stopping power)
is small in most cases shown, cf. plot for Ar ions in Al below.
- For ions heavier than helium, you can also
see "universal" plots, where all the data for the particular ion
are shown on one graph (see introduction to "Heavier Ions"
below).
- There are separate chapters below for hydrogen ions, helium ions and heavier ions. In addition, there is a chapter on "oscillations", i.e., graphs showing the stopping power
as a function of the atomic number of ion or target, and a chapter on statistical analyses.
- To download all the files of experimental
data (including those not yet shown in the graphs), click here. For historical reasons, the
target designations are limited to five characters.
- To see a list of the compounds
treated in our statistical analyses, click here.
- To see a list of data rejected in
these analyses, see statistical analyses.
- The data reference codes are explained
in the list of all data references , and the curve
designations in the list of stopping power tables
and programs.
Hydrogen
Ions.
Earlier graphical
presentations can be found in AZ77, Z77, ICRU49 and BP95 (these reference codes
are explained in the list of stopping power tables and programs ).
See also: H. Paul, D.
Semrad and A. Seilinger, "Reference stopping cross sections
for hydrogen and helium ions in selected elements", Nucl. Instr. Methods in Phys. Res. B61 (1991)
261
Do you want to see the list
of all the data for hydrogen ions available in my files? In this list, every line corresponds to one data
file. The targets are ordered alphabetically. The headings in the list have the
following meaning:
|
M |
Mass Number of Projectile |
|
Eq. Energy |
Equivalent Proton Energy,
i.e., energy of a proton of equal speed |
|
Error |
Error in percent. "e" means estimate. |
|
Ref. |
Reference Code, see list
of all data references |
|
Meas. |
Number of measurement
within the publication (you don’t need that!) |
|
Method |
Method of measurement
according to classification by Paul, Semrad and Seilinger, Table 5 |
|
Ag. |
State of aggregation (s:
solid; g: gaseous). G: graphite (as opposed to amorphous carbon) |
|
File |
File designation: the
file name Al.005, e.g., means file number 5 for hydrogen ions on Al. |
In the graphs below,
electronic stopping power in 10-15eV cm2/atom is plotted
versus equivalent proton energy. Symbol A means file number 1 (e.g., file
Al.001 for Al targets), symbol B means file number 2, etc. The data reference
codes are explained in the list of all data references , and the curve designations in the
list of stopping power tables and programs .
Graphs are only shown where at least two or three data files are available for the particular target. At present, graphs are available for the following targets:
Ions
|
Target
|
To see graph
|
Remark
|
|
H ions |
Acetylene |
|
|
|
H ions |
Ag |
At low energy,
stopping is proportional to v, but at 1 keV, the proportionality constant
changes (see Gö13) |
|
|
H ions |
Air |
|
|
|
H ions |
Al, versus v |
For H in Al, stopping is proportional to velocity |
|
|
H ions |
Al |
The new CasP version
3.0 is now correct down to 20 keV |
|
|
H ions |
Al2O3 |
The large binding
effect of this compound is not well described by Ziegler’s program |
|
|
H ions |
Ar |
Z03 agrees well with the
data, ZBL85=Z92 was too low. After including electron capture, SG11 agrees
with data at the maximum. |
|
|
H ions |
Au |
A threshold for
emission of 5d electrons has been found by Mk08 at 0.9
keV/nucleon. |
|
|
H ions |
Au, versus v |
The measurements by
Mk07 and Mk08 (similar to those by Fg07 for channeled ions) show a threshold
effect at v = 0.19 v0. The theory byZeb12 shows a change of
steepness there. |
|
|
H ions |
B |
|
|
|
H ions |
Be |
|
|
|
H ions |
Bi |
Good agreement of Z03
with the data |
|
|
H ions |
Br |
Excellent agreement
between Ba84 and the Z03 curve for gaseous Br |
|
|
H ions |
C amorphous |
The program by Grande and Schiwietz (GS00) using a single value for the mean excitation energy is low at the maximum, but agrees well with the data if different excitation energies are used for the subshells (GS00osc). The Op75 data appear high |
|
|
H ions |
Ca |
At low energy, the
Ep94a data are higher than all the semiempirical curves |
|
|
H ions |
Cd |
Excellent agreement of
Z03 with the scant data |
|
|
H ions |
Ce |
The low Si72 data are
apparently incorrect (see Kn80) |
|
|
H ions |
CH4 |
|
|
|
H ions |
Cl |
Excellent agreement
between Z03 and the only data (Ba84) |
|
|
H ions |
Co |
|
|
|
H ions |
CO2 |
|
|
|
H ions |
Cr |
Good agreement of Z03
with all the data |
|
|
H ions |
Cu |
The Gt62 and No75 data
appear too low |
|
|
H ions |
Diamond |
|
|
|
H ions |
Ethylene |
|
|
|
H ions |
Fe |
Good agreement of Z03
with all the data (except for Ar69) |
|
|
H ions |
Formvar |
|
|
|
H ions |
GaAs |
|
|
|
H ions |
GaSb |
|
|
|
H ions |
Gd |
Excellent agreement of
Z03 with the data, ICRU49 is too high |
|
|
H ions |
Ge, versus v |
There is a clear
threshold velocity |
|
|
H ions |
Ge |
Discrepancy especially
between Me82a and Ep92. But Mertens data before 1986 tend to be generally
high |
|
|
H ions |
Graphite |
|
|
|
H ions |
H2 |
Z85 and Z89 are much too
low here, but Z03 is good. The Cr42 data are too low |
|
|
H ions |
H2O Phase effect |
The ICRU curves agree
with the vapor data and with the Wenzel ice data within 2-3%. The gas-solid
difference of ICRU ( 13%) is close to the
experimental value. |
|
|
H ions |
H2O vapor |
|
|
|
H ions |
H2O cond. logar. |
First measurements of stopping
power of liquid water for protons! |
|
|
H ions |
H2O cond.
linear |
|
|
|
H ions |
H2O liq. rel. |
Relative graph shows
discrepancies |
|
|
H ions |
Havar |
Excellent agreement of
the data with each other and with Z03 |
|
|
H ions |
He |
The two measurements Gl91
and RG01, though in mutual conflict, show a very strong threshold effect. At
low energy, ICRU49 = AZ77 is too high (velocity proportional!). The theories
GS93, Kim93 and Oliv94 support the Gl91 data, but not RG01. The Cab00 theory
appears to support RG01, but it is too low since it considers only protons,
not H atoms. |
|
|
H ions |
HfO2 |
|
|
|
H ions |
Hydroxy apatite |
|
|
|
H ions |
In |
Excellent agreement of
Z03 with the data |
|
|
H ions |
Kapton (Polyimide) |
|
|
|
H ions |
KCl, versus v |
The new Mk09 data show
an extrapolated threshold |
|
|
H ions |
Kr |
SG11 agrees with data at the maximum, due to inclusion of electron
capture |
|
|
H ions |
Li |
Z03 is good, but
earlier versions are too low |
|
|
H ions |
LiF |
|
|
|
H ions |
LiF, versus v |
The new Mk09 data show
a stopping power threshold at v = 0.1 a.u. (250 eV/u) |
|
|
H ions |
LR-115 |
Cellulose Nitrate
Nuclear Track Detector |
|
|
H ions |
Methane |
|
|
|
H ions |
Mg |
The large gas-solid
difference found by Bauer et al is not described by Ziegler’s program Z03 |
|
|
H ions |
Mo |
|
|
|
H ions |
Mylar |
|
|
|
H ions |
N2 |
The low points due to
B82a are for solid N2 |
|
|
H ions |
Nb |
The Bh73 data appear
too low compared to Si84, Bi86, and Z03 is too high |
|
|
H ions |
Ne |
CasP5.0 is too low, but SG11 agrees with data
at the maximum, due to inclusion of electron capture |
|
|
H ions |
Ni |
Here, there is an old discrepancy: many data are higher than the Linz data due to Se86a. It could be that many transmission measurements are high (cf. Mertens, Bauer, Semrad, Nucl. Instr. Meth. B15(1986) 91) |
|
|
H ions |
O2 |
Excellent agreement
between all data and Z03 |
|
|
H ions |
Pb |
At low energy, the Ep92
data look unusual, but the Mont09a curve is close to them. |
|
|
H ions |
Pd |
Excellent agreement of
Z03 with the scant data |
|
|
H ions |
Polycarbonate |
|
|
|
H ions |
Polyethylene |
|
|
|
H ions |
Polypropylene |
|
|
|
H ions |
Polystyrene |
|
|
|
H ions |
Polyvinyltoluene |
|
|
|
H ions |
Propylene |
|
|
|
H ions |
Pt |
Excellent agreement of
Z03 with the data; ICRU49 is too high. At low energy, stopping is
proportional to velocity (Gö13) |
|
|
H ions |
Rb |
Z03 agrees very well
with Ep94b; earlier curves are too low |
|
|
H ions |
Sb |
Excellent agreement of
Z03 with the data |
|
|
H ions |
Si |
The Ar69 and Gm76 data
appear too low. SRIM 2006 and SRIM 2003 give identical stopping powers |
|
|
H ions |
SiC |
|
|
|
H ions |
SiO2 |
|
|
|
H ions |
SiO2, versus v |
The Mk09a data show a
threshold at low velocity |
|
|
H ions |
Sn |
|
|
|
H ions |
Sr |
|
|
|
H ions |
SrTiO3 |
|
|
|
H ions |
Ta |
The Si72 data appear
too low compared to Lu79, Si84, etc. |
|
|
H ions |
Ti |
The Gt62 and Ar69 data
appear too high compared to Or71 |
|
|
H ions |
V |
Excellent agreement of
Z03 with the data |
|
|
H ions |
W |
Excellent agreement of
Z03 with the data |
|
|
H ions |
Xe |
Excellent agreement of
Z03 with the data; ICRU 49 fits less well at 2000 keV |
|
|
H ions |
Y |
At the maximum, all the
curves are below the data |
|
|
H ions |
Yb |
The low Si72 data are
apparently incorrect (see Kn80) |
|
|
H ions |
Zn |
The large gas-solid difference
found by Bauer et al is not described by Ziegler’s program |
|
|
H ions |
ZnSiP2 |
|
|
|
H ions |
Zr |
Excellent agreement between
Z03 and the scant data |
To use the Origin files,
click here to get file H-Files.zip which contains the
compressed version of all the *.org files for H ions, and continue as outlined
in Ch. 1.
Helium
Ions.
Earlier graphical
presentations can be found in Z77, ICRU49 and BP95 (these reference codes are
explained in the list of stopping power tables and programs ).
See also: H. Paul, D.
Semrad and A. Seilinger, "Reference stopping cross sections
for hydrogen and helium ions in selected elements", Nucl. Instr. Methods in Phys. Res. B61 (1991)
261
Do you want to see the list of all the data for helium ions
available in my files? The list was brought up to date in 2007. The headings
are similar to those of the list for hydrogen ions (see above). In the graphs
below, electronic stopping power in E(-15)eVcm2/atom
is plotted versus equivalent alpha energy. Symbol A means file number 1 (e.g.,
file C.01 for C targets), symbol B means file number 2, etc. The data reference
codes are explained in the list of all data references , and the curve designations in the
list of stopping power tables and programs
Graphs are only shown where at least two or three data files are available for the particular target. At present, graphs are available for the following targets:
Ions
|
Target
|
To see graph
|
Remark
|
|
He Ions |
Acetylene |
|
|
|
He Ions |
Ag |
At low energy,
stopping is proportional to velocity, but at 3 keV, the velocity constant
changes (see Gö13) |
|
|
He Ions |
Air |
|
|
|
He Ions |
Al, versus v |
For He in Al, stopping is velocity-proportional, but with different
slopes in two different regions, indicating charge exchange between He and Al
atoms |
|
|
He Ions |
Al |
The first-principles
charge-state calculation by Arnau et al. follows the data well except at the
maximum. The new Bichsel calculation is slightly high at low energy |
|
|
He Ions |
Al2O3 |
|
|
|
He Ions |
Ar |
In agreement with Chu’s and Besenbacher’s measurements, Z03 (SRIM2003) predicts no gas-solid difference. Excellent agreement of Z03 and ICRU 49 with the data |
|
|
He Ions |
Au |
Pe81 data are too high
compared to many others |
|
|
He Ions |
Au, versus v |
There is an indication
of a stopping threshold similar to the case of H ions in Au. The theory by
Zeb12 shows a change of steepness there. |
|
|
He Ions |
B |
|
|
|
He Ions |
Be |
|
|
|
He Ions |
Bi |
Good agreement of Z03
with the data |
|
|
He Ions |
Butane |
|
|
|
He Ions |
C |
Pe81 data are too high
compared to many others |
|
|
He Ions |
Ca |
Large discrepancy
between Eppacher measurement and Z03 |
|
|
He Ions |
CF4 |
|
|
|
He Ions |
CO2 |
|
|
|
He Ions |
CCl4 liquid, vapor |
|
|
|
He Ions |
Co |
Excellent agreement of
Z03 with the data |
|
|
He Ions |
Cr |
The second graph shows
the low energy data by Sp98 better; reevaluated Sp98 data are shown by
circles (cf. remarks for Mo) |
|
|
He Ions |
Cu |
The second graph shows
the low energy data by Sp98 better; reevaluated Sp98 data are shown by
circles (cf. remarks for Mo) |
|
|
He Ions |
Cyclohexane liquid, vapor |
|
|
|
He Ions |
Cyclopropane |
|
|
|
He Ions |
Dy |
Good agreement of Z03
with most of the data |
|
|
He Ions |
Ethane |
|
|
|
He Ions |
Ethyl alcohol liquid |
|
|
|
He Ions |
Ethyl alcohol liquid, vapor |
|
|
|
He Ions |
Ethylene |
|
|
|
He Ions |
Fe |
Good agreement of the
curves (except for Z99) with most of the data |
|
|
He Ions |
Formvar |
|
|
|
He Ions |
GaSb |
|
|
|
He Ions |
Ge |
|
|
|
He Ions |
H2 |
Good agreement between
Z03, ICRU 49 and the data |
|
|
He Ions |
H2S |
|
|
|
He Ions |
Havar |
|
|
|
He Ions |
He |
Excellent agreement
between curves and data (except for Hb72) |
|
|
He Ions |
Heptane liquid, vapor |
|
|
|
He Ions |
Hexane liquid, vapor |
|
|
|
He Ions |
HfO2 |
|
|
|
He ions |
Hydroxy apatite |
|
|
|
He Ions |
InN |
|
|
|
He Ions |
Kapton, Polyimide |
|
|
|
He Ions |
KCl, versus v |
The new Mk09 data show
an (extrapolated) threshold |
|
|
He Ions |
Kr |
Good agreement of Z03
and ICRU 49 with the data |
|
|
He Ions |
LiF, versus v |
The new Mk09 data show
a threshold at v = 0.1 a.u. (250 eV/u) |
|
|
He Ions |
Methane |
|
|
|
He Ions |
Methyl alcohol liquid, vapor |
|
|
|
He Ions |
Mg |
|
|
|
He Ions |
Mo |
The Sp98 data are exceptional
in that they go down as far as 0.01 keV (see the second graph). But these
values are based on an evaluation of measured ranges for 5 - 100 keV He ions,
taking the energy dependence from TRIM 95. We re-evaluated the Sp98 data by a
comparison with Monte Carlo ranges from SRIM 2003 (circles). |
|
|
He Ions |
Mylar |
|
|
|
He Ions |
N2 |
Excellent agreement
between curves and the data |
|
|
He Ions |
Ne |
Excellent agreement
between curves and data |
|
|
He Ions |
Ni |
Excellent agreement of
Z03 with the data above 20 keV. See also remark for Mo. |
|
|
He Ions |
O2 |
Excellent agreement
between Z03, ICRU 49 and data |
|
|
He Ions |
Pb |
|
|
|
He Ions |
Pentane liquid, vapor |
|
|
|
He Ions |
3-Pentanone vapor |
|
|
|
He Ions |
Polycarbonate |
|
|
|
He Ions |
Polypropylene |
|
|
|
He Ions |
Polystyrene |
|
|
|
He Ions |
Polysulfone |
|
|
|
He Ions |
Propane |
|
|
|
He Ions |
Propyl alcohol vapor |
|
|
|
He Ions |
Propylene |
|
|
|
He Ions |
Propylene oxide vapor |
|
|
|
He Ions |
Pt |
Good agreement between
Z03 and the data. At low energy, stopping is proportional to velocity, but
the velocity constant changes at 4 keV (Gö13). |
|
|
He Ions |
Se |
Fair agreement of Z03 with
the data, except for Co83 |
|
|
He Ions |
SF6 |
|
|
|
He Ions |
Si |
The ICRU 49 curve
appears slightly low at the maximum |
|
|
He Ions |
SiC |
|
|
|
He Ions |
SiO2 |
|
|
|
He Ions |
SiO2, versus v |
Contrary to the hydrogen
data, the helium data do not show a threshold |
|
|
He Ions |
Sn |
Good agreement of Z03
with the data except for Ep94a |
|
|
He Ions |
Ta |
Excellent agreement of
Z03 with the data |
|
|
He Ions |
Ta2O5 |
|
|
|
He Ions |
Ti |
Good agreement of the
curves with the data (except for Gt62) |
|
|
He Ions |
V |
Excellent agreement of
Z03 with the data |
|
|
He Ions |
Vyns |
|
|
|
He Ions |
W |
Good agreement |
|
|
He Ions |
Water |
GarM09 curve reproduces
the data quite well |
|
|
He Ions |
Water |
|
|
|
He Ions |
Water vapor |
|
|
|
He Ions |
Xe |
Excellent agreement of
Z03 with the data; ICRU 49 fits less well at 2000 keV |
|
|
He Ions |
Y |
Fair agreement of Z03
with the data, except for Ep94a at low energy |
|
|
He Ions |
Zn |
|
|
|
He Ions |
ZnTe |
|
|
|
He Ions |
Zr |
Good agreement of Z03
with the scant data |
To use the Origin files,
click here to get file He-Files.zip which contains the compressed
version of all the *.org files for He ions, and continue as outlined in Ch. 1.
Heavier Ions
Do you want to see the List of all the data for heavier ions
available in my files? See also the matrix which shows the number of available data files
for all Z1 - Z2 - combinations, where Z1 is
the atomic number of the projectile, Z2 that of the target. Z2
> 100 refers to mixtures and compounds. Please note that generally, graphs
are only shown if at least three data files from different publications are
available for the particular ion-target combination. So the data files are more
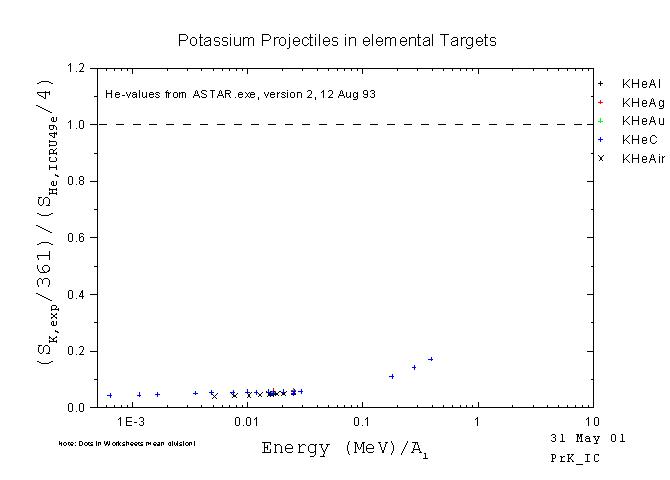
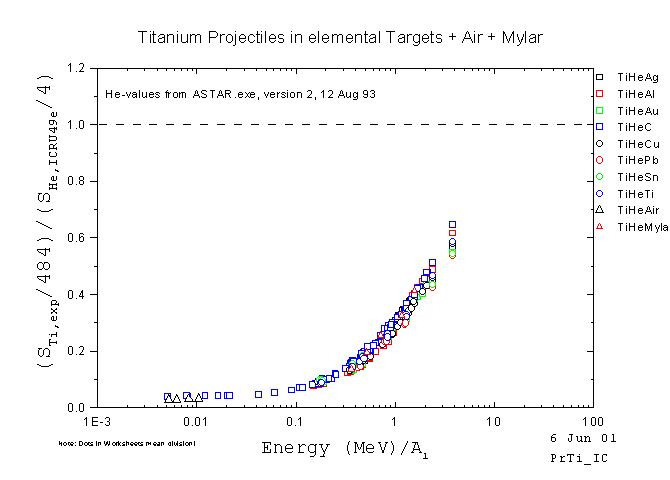
complete than the graphs. In the graphs below, electronic stopping power in MeV/(mg/cm2) is plotted versus projectile energy per nucleon.
Symbol A means file number 1, symbol B means file
number 2, etc. The data reference codes are explained in the list
of all data references , and the curve designations in the list of stopping power tables and
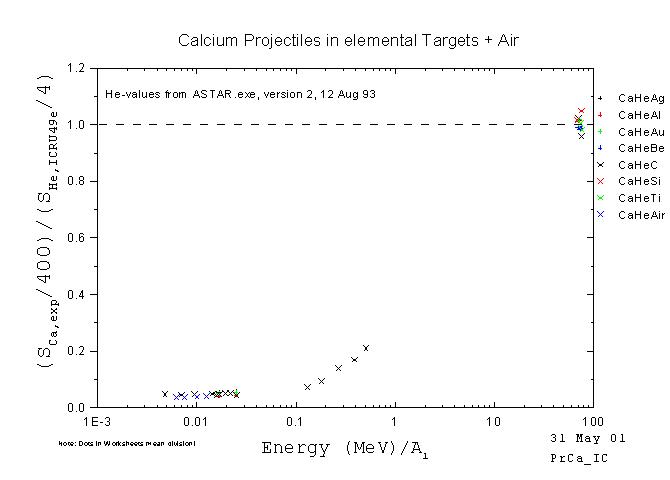
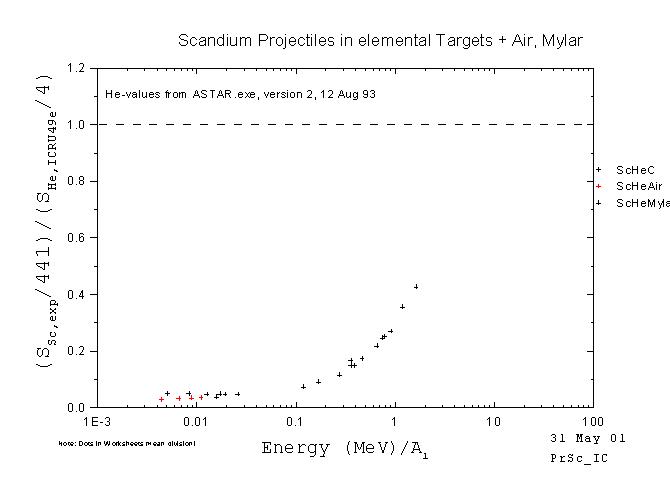
programs . For ions
up to Ti, there are also "universal plots" showing all the data
obtained with one projectile. The data are divided by the electronic alpha
stopping powers from ICRU Report 49, and normalized in such a way that they
approach unity at high energy.
Graphs are only shown where
at least two or three data files are available for the particular target. At
present, graphs are available for the following projectiles and targets:
Projectiles
|
Target
|
To see graph:
|
Remarks
|
|
|
3Li ions |
Ag |
ICRU 73 is too high,
CasP is too low at low energy |
||
|
Air |
Data by Hv71 appear
low |
|||
|
Al |
|
|||
|
Ar |
|
|||
|
Au |
Note that Ziegler's stopping
power has been improved (increased) since Z92. |
|||
|
B |
|
|||
|
C |
Here, many curves stay
below the data at the maximum! |
|||
|
CH4 |
|
|||
|
CO2 |
PASS too high at low
energy |
|||
|
Cu |
PASS too high |
|||
|
Gd |
|
|||
|
H2 |
|
|||
|
He |
Data by Hv71 appear
low. PASS too high at low energy |
|||
|
Lu |
|
|||
|
Kapton |
|
|||
|
Mylar |
|
|||
|
N2 |
|
|||
|
Ne |
Data by Hv71 appear
low. PASS too high at low energy |
|||
|
Ni |
The BEST curve is only good at high energy. PASS too high |
|||
|
Pd |
|
|||
|
Polycarbonate |
|
|||
|
Polypropylene |
|
|||
|
Si |
The measurements by
BA09 (in bulk Si) are evidently too high at low energy. The CasP 4.0 curve is
too low, while the ICRU73 curve is somewhat high |
|||
|
SiO2 |
|
|||
|
Ta |
|
|||
|
Ti |
|
|||
|
Toluene |
|
|||
|
Water, liquid |
|
|||
|
Zn |
|
|||
|
Here is the universal
plot for Li ions!
To get the ORIGIN files, click here to get file Li-Files.zip, and continue as
outlined in Ch. 1 |
||||
|
4Be ions |
Al |
Point by Ang00 high
compared to Zha02b |
||
|
Au |
|
|||
|
C |
|
|||
|
Fe |
|
|||
|
He |
|
|||
|
Ne |
|
|||
|
Ni |
|
|||
|
Si |
|
|||
|
Zn |
|
|||
|
Here is the universal
plot for Be ions!
To get the ORIGIN files, click here to get file Be-Files.zip, and continue as
outlined in Ch. 1 |
||||
|
5B ions |
Ag |
|
||
|
Air |
|
|||
|
Al |
|
|||
|
Ar |
|
|||
|
Au |
Data by Bt65 low
compared to other data |
|||
|
B |
|
|||
|
C |
|
|||
|
Gd |
|
|||
|
Mylar |
|
|||
|
N2 |
|
|||
|
Ni |
Data by Bt65 low
compared to other data |
|||
|
Poly carbonate |
|
|||
|
Si |
This figure is quite similar
to Fig. 14 of the Konac paper (KO98). Surprisingly, the Ziegler curve fits
the data by the same group (Ds97) better than the Konac curve (KO98). |
|||
|
Zn |
|
|||
|
Here is the universal
plot for B ions!
To get the ORIGIN files, click here to get file B-Files.zip, and continue as
outlined in Ch. 1 |
||||
|
6C ions |
Ag |
|
||
|
Air |
|
|||
|
Al |
|
|||
|
Al2O3 |
|
|||
|
Ar |
The MSTAR curves follow the data points
very well |
|||
|
Au |
|
|||
|
B |
|
|||
|
Be |
Note the remarkable
discrepancy between the (only) two data sets for C on Be! |
|||
|
C |
The Ziegler, ATIMA, PASS
and MSTAR curves fit the data quite well, the Konac curve (KO98) does not (at
high energy because of the chosen I-value). Below the maximum, Geant4 becomes
unreliable. CasP fits well except at low energy |
|||
|
Cu |
|
|||
|
Ge |
|
|||
|
Graphite |
|
|||
|
H |
|
|||
|
He |
|
|||
|
Kapton |
|
|||
|
Mylar |
|
|||
|
N |
|
|||
|
Ni |
Hu00 Data appear too
steep compared to Sa91, Po60, Ve79. In Hu00, the
numbers in Table1 disagree with Fig. 1. |
|||
|
Polycarbonate |
|
|||
|
Polyvinyl chloride |
|
|||
|
Si |
|
|||
|
Silicon nitride |
|
|||
|
Silicon dioxide |
|
|||
|
Ta |
|
|||
|
Ti |
|
|||
|
Zr |
|
|||
|
ZrO2 |
|
|||
|
Here is the universal
plot for C ions!
To get the ORIGIN files, click here to get file C-Files.zip,
and continue as outlined in Ch. 1 |
||||
|
7N ions |
Ag |
IDSA Data by Zi87
extrapolate to finite value for v=0: strange! |
||
|
Air |
|
|||
|
Al |
Sa91 and Na68 data
appear too high |
|||
|
Al2O3 |
|
|||
|
Ar |
Data by Fu96 very low
compared to Or68, We53 |
|||
|
Au |
Nd77 data appear too steep |
|||
|
C |
|
|||
|
Cu |
IDSA Data by Zi87
extrapolate to finite value for v=0: strange! |
|||
|
Ge |
|
|||
|
H |
|
|||
|
He |
|
|||
|
N |
|
|||
|
Kr |
|
|||
|
Mylar |
|
|||
|
Ne |
|
|||
|
Ni |
IDSA Data by Zi87
extrapolate to finite value for v=0: strange! |
|||
|
Polycarbonate |
|
|||
|
Si |
|
|||
|
SiC |
|
|||
|
SiO2 |
|
|||
|
Ta |
|
|||
|
Ti |
|
|||
|
Xe |
|
|||
|
Here is the universal
plot for N ions! To
get the ORIGIN files, click here to get file N-Files.zip, and continue as
outlined in Ch. 1 |
||||
|
8O ions |
Ag |
|
||
|
Air |
|
|||
|
Al |
|
|||
|
Al2O3 |
|
|||
|
Ar |
|
|||
|
Au |
Nd77 data appear too
steep, see also 2001 paper by Paul and Schinner |
|||
|
B |
|
|||
|
Be |
Note the remarkable
discrepancy between the data sets Ch68 and Sa92, similar to the case of
carbon ions on Be! |
|||
|
C |
Below the maximum , Geant4 becomes unreliable, GS (CasP) is somewhat low. At the maximum, NS70 is slightly high |
|||
|
Cu |
|
|||
|
H2 |
|
|||
|
He |
The points at 95
MeV/nucleon appear high. |
|||
|
In |
|
|||
|
Kapton |
|
|||
|
Mylar |
|
|||
|
N2 |
|
|||
|
Ne |
|
|||
|
Ni |
|
|||
|
O2 |
|
|||
|
Poly carbonate |
|
|||
|
Si |
|
|||
|
SiC |
|
|||
|
Silicon nitride |
|
|||
|
Sn |
|
|||
|
Ta |
|
|||
|
Ta2O5 |
|
|||
|
Ti |
|
|||
|
Zn |
Combining the EFSR-TCS
approach with CasP brings theory close to experiment |
|||
|
ZrO2 |
|
|||
|
Here is the universal
plot for O ions!
To get the ORIGIN files, click here to get file O-Files.zip,
and continue as outlined in Ch. 1 |
||||
|
9F ions |
Ag |
|
||
|
Al |
|
|||
|
Au |
|
|||
|
C |
|
|||
|
Cu |
|
|||
|
Mo |
|
|||
|
N2 |
|
|||
|
Ni |
|
|||
|
Poly- carbonate |
|
|||
|
Si |
|
|||
|
Ti |
|
|||
|
Here is the universal
plot for F ions!
To get the ORIGIN files, click here to get file F-Files.zip,
and continue as outlined in Ch. 1 |
||||
|
10Ne ions |
Ag |
Data by Tp62 low
compared to other data |
||
|
Air |
|
|||
|
Al |
|
|||
|
Ar |
|
|||
|
Au |
The Nd77 data appear too
steep (for other discrepant Nd77 data, see 2001 paper
). |
|||
|
C |
The Po61 data appear
high. Z98 lies high above Z96 and Z99. |
|||
|
H |
|
|||
|
He |
At the maximum, the
curves by Ziegler and MSTAR differ considerably, but there are no
experimental points to decide. |
|||
|
N |
|
|||
|
Ni |
|
|||
|
Si |
|
|||
|
Here is the universal
plot for Ne ions!
To get the ORIGIN files, click here to get file Ne-Files.zip, and continue as
outlined in Ch. 1 |
||||
|
11Na ions |
Air |
|
||
|
Al |
|
|||
|
Ar |
|
|||
|
C |
|
|||
|
Mylar |
|
|||
|
Here is the universal
plot for Na ions!
To get the ORIGIN files, click here to get file Na-Files.zip, and continue as
outlined in Ch. 1 |
||||
|
12Mg ions |
Ag |
Note large discrepancy
between data by At90 and Wr79, see also 2001 paper |
||
|
Air |
Data by Hv71 low
compared to Fa68 |
|||
|
Al |
|
|||
|
Au |
Note large discrepancy
between data by At90 and Wr79, see also 2001 paper |
|||
|
C |
|
|||
|
Cu |
|
|||
|
Fe |
|
|||
|
He |
|
|||
|
Ni |
|
|||
|
Poly- carbonate |
|
|||
|
Si |
|
|||
|
Ta |
|
|||
|
Here is the universal
plot for Mg ions!
To get the ORIGIN files, click here to get file Mg-Files.zip, and continue as
outlined in Ch. 1 |
||||
|
13Al ions |
Ag |
|
||
|
Al |
|
|||
|
Au |
|
|||
|
C |
Data by Po61 low
compared to Fa66. All the curves fit the data well |
|||
|
Mylar |
Ziegler's (SRIM 2001)
Bragg correction is visible: the corrected curve has a 5% step at 10 MeV (0.37 MeV/nucleon) |
|||
|
Ni |
|
|||
|
Poly- carbonate |
|
|||
|
SiC |
|
|||
|
Ta |
|
|||
|
Here is the universal
plot for Al ions!
To get the ORIGIN files, click here to get file Al-Files.zip, and continue as
outlined in Ch. 1 |
||||
|
14Si ions |
Al |
For comparison,
"nuclear" stopping is shown as calculated by SRIM |
||
|
Ag |
|
|||
|
Au |
The Nd77 data appear low
(for other discrepant Nd77 data, see 2001 paper
). |
|||
|
C |
The KO98 curve is
surprisingly high. |
|||
|
Cu |
|
|||
|
GaAs |
|
|||
|
Ge |
|
|||
|
Mylar |
|
|||
|
Ni |
|
|||
|
Polycarbonate |
|
|||
|
Polypropylene |
|
|||
|
Si |
|
|||
|
SiO2 |
Good agreement with ICRU73 and SRIM. MSTAR slightly low |
|||
|
W |
|
|||
|
Zr |
|
|||
|
Here is the universal
plot for Si ions!
To get the ORIGIN files, click here to get file Si-Files.zip, and continue as
outlined in Ch. 1 |
||||
|
15P ions |
Al |
|
||
|
C |
|
|||
|
Ge |
|
|||
|
Ni |
|
|||
|
Si |
|
|||
|
Here is the universal
plot for P ions!
To get the ORIGIN files, click here to get file P-Files.zip,
and continue as outlined in Ch. 1 |
||||
|
16S ions |
Ag |
|
||
|
Air |
|
|||
|
Ar |
|
|||
|
Au |
Note that the (high) values of Bt66 are no more mentioned by Sd75, even though both publications have a common author . See 2001 paper by Paul and Schinner |
|||
|
C |
|
|||
|
Cu |
|
|||
|
H2 |
|
|||
|
He |
|
|||
|
Kr |
|
|||
|
N2 |
|
|||
|
Ni |
|
|||
|
Here is the universal
plot for S ions!
To get the ORIGIN files, click here to get file S-Files.zip, and continue as
outlined in Ch.1 |
||||
|
17Cl ions |
Ag |
|
||
|
Air |
|
|||
|
Al |
|
|||
|
Al2O3 |
|
|||
|
Ar |
|
|||
|
Au |
|
|||
|
C |
|
|||
|
H2 |
|
|||
|
He |
|
|||
|
Mylar |
|
|||
|
SiC |
|
|||
|
Silicon nitride |
|
|||
|
N2 |
|
|||
|
Ni |
|
|||
|
Ta2O5 |
|
|||
|
Here is the universal
plot for Cl ions!
To get the ORIGIN files, click here to get file Cl-Files.zip,
and continue as outlined in Ch.1 |
||||
|
18Ar ions |
Ag |
|
||
|
Air |
|
|||
|
Al |
All the electronic
stopping curves agree well with the data, except for Bar10 and libdEdx.
"Nuclear" is the total nuclear stopping, integrated over all
scattering angles, calculated using SRIM |
|||
|
Ar |
The Barbui curve (Barb10) fits the data
well |
|||
|
Au |
The Nd77 data are too
low |
|||
|
Be |
|
|||
|
Butane |
|
|||
|
C |
The low energy Trz02
data appear low. Jav12 fits well. |
|||
|
CH4 |
|
|||
|
CO2 |
|
|||
|
Cu |
|
|||
|
H2 |
Here, most of the curves
(Ziegler, CasP, Hiraoka, Northcliffe) lie below the data, but MSTAR fits well |
|||
|
He |
|
|||
|
Kr |
|
|||
|
Mylar |
|
|||
|
N2 |
|
|||
|
Ne |
|
|||
|
Ni |
|
|||
|
Poly carbonate |
|
|||
|
Si |
|
|||
|
Ta |
|
|||
|
Ti |
|
|||
|
Zr |
|
|||
|
Here is the universal
plot for Ar ions!
To get the ORIGIN files, click here to get file Ar-Files.zip, and continue as
outlined in Ch.1 |
||||
|
19K ions |
C |
|
||
|
Here is the universal
plot for K
ions! Click here to get file K-Files.zip which contains the
compressed version of all the ORIGIN files for K ions, and continue as
outlined in Ch.1 |
||||
|
20Ca ions |
C |
|
||
|
Ni |
|
|||
|
Au |
|
|||
|
Here is the universal
plot for Ca ions!
Click here to get file Ca-Files.zip which contains the
compressed version of all the *.org files for Ca ions, and continue as
outlined in Ch.1 |
||||
|
21Sc ions |
C |
|
||
|
Here is the universal
plot for Sc ions!
Click here to get file Sc-Files.zip which contains the
compressed version of all the *.org files for Sc ions, and continue as
outlined in Ch.1 |
||||
|
22Ti ions |
Ag |
|
||
|
Al |
|
|||
|
Au |
|
|||
|
C |
|
|||
|
Cu |
|
|||
|
Ta |
|
|||
|
Here is the universal
plot for Ti
ions! Click here to get file Ti-Files.zip which contains the
compressed version of all the ORIGIN files for Ti ions, and continue as
outlined in Ch.1 |
||||
|
24Cr ions |
C |
|
||
|
Click here to
get file Cr-Files.zip which contains the compressed version of all the ORIGIN
files for Cr ions |
||||
|
25Mn ions |
C |
|
||
|
Click here to
get file Mn-Files.zip which contains the compressed version of all the ORIGIN
files for Mn ions |
||||
|
26Fe ions |
C |
|
||
|
Click here to
get file Fe-Files.zip which contains the compressed version of all the ORIGIN
files for Fe ions |
||||
|
27Co ions |
SiC |
|
||
|
Click here to
get file Co-Files.zip which contains the compressed version of all the ORIGIN
files for Co ions |
||||
|
28Ni ions |
Ag |
Here, NS70 is low at
the maximum |
||
|
Al |
The Hak02 data seem
strange |
|||
|
C |
The theoretical program GB04 agrees
beautifully with experiment at 1 MeV/nucleon |
|||
|
Cu |
|
|||
|
SiC |
|
|||
|
Click here to
get file Ni-Files.zip which contains the compressed version of all the ORIGIN
files for Ni ions |
||||
|
29Cu ions |
Ag |
|
||
|
Al |
Here, NS70 is low at
the maximum. Diwan01 extends the Hubert curve to lower energy. Jav12 fits the
data |
|||
|
Au |
|
|||
|
C |
Here, NS70 is low at
the maximum |
|||
|
Cu |
|
|||
|
H2 |
|
|||
|
SiC |
|
|||
|
Click here to
get file Cu-Files.zip which contains the compressed version of all the ORIGIN
files for Cu ions |
||||
|
32Ge ions |
Ag |
|
||
|
Al |
|
|||
|
C |
|
|||
|
Click here to get
file Ge-Files.zip which contains the compressed version of all the ORIGIN
files for Ge ions |
||||
|
33As ions |
Si |
|
||
|
Click here to get
file As-Files.zip which contains the compressed version of all the ORIGIN
files for As ions |
||||
|
35Br ions |
Ag |
|
||
|
Al |
|
|||
|
Au |
|
|||
|
C |
|
|||
|
Cu |
|
|||
|
SiC |
|
|||
|
Click here to
get file Br-Files.zip which contains the compressed version of all the ORIGIN
files for Br ions |
||||
|
36Kr ions |
Ag |
|
||
|
Al |
The Northcliffe (NS)
curve is low, while the Hubert curve (HU90) fits the data well |
|||
|
Ar |
|
|||
|
Au |
|
|||
|
Be |
|
|||
|
Butane |
|
|||
|
C |
Jav12 fits pretty well |
|||
|
Carbon dioxide |
|
|||
|
CF4 |
|
|||
|
Cu |
|
|||
|
H2 |
|
|||
|
He |
|
|||
|
Kr |
|
|||
|
Methane |
The Barbui curve (Barb10) fits the data
very well |
|||
|
Mylar |
|
|||
|
N2 |
|
|||
|
Ne |
|
|||
|
Ni |
|
|||
|
Si |
|
|||
|
Sn |
|
|||
|
Ta |
|
|||
|
Ti |
|
|||
|
Xe |
|
|||
|
Zr |
|
|||
|
Click here to get
file Kr-Files.zip which contains the compressed version of all the ORIGIN
files for Kr ions |
||||
|
41Nb ions |
Ni |
|
||
|
Ta |
|
|||
|
Click here to
get file Nb-Files.zip which contains the compressed version of all the ORIGIN
files for Nb ions |
||||
|
47Ag ions |
Al |
|
||
|
Fe |
|
|||
|
Ni |
|
|||
|
Pd |
|
|||
|
Ti |
|
|||
|
V |
|
|||
|
Zn |
|
|||
|
Zr |
|
|||
|
Click here to
get file Ag-Files.zip which contains the compressed version of all the ORIGIN
files for Ag ions |
||||
|
52Te ions |
H2 |
|
||
|
Click here to get
file Te-Files.zip which contains the compressed version of all the ORIGIN
files for Te ions |
||||
|
53I ions |
Ag |
|
||
|
Al |
The Barbui curve (Bar10) is too low at low energy |
|||
|
Au |
|
|||
|
C |
|
|||
|
Cu |
|
|||
|
H2 |
|
|||
|
Ni |
|
|||
|
SiC |
|
|||
|
Click here to get
file I-Files.zip which contains the compressed version of all the ORIGIN
files for I ions |
||||
|
54Xe ions |
Ag |
The Barbui curve (Bar10) is too low at low energy |
||
|
Al |
The Barbui curve (Bar10) is too low at low energy; Jav12 fits
pretty well |
|||
|
Ar |
|
|||
|
Au |
|
|||
|
Be |
The point at 4 MeV/n
is represented by Hubert, but not by Z03 |
|||
|
C |
Ziegler appears too low
for light targets, but Hubert fits the data. |
|||
|
Cu |
|
|||
|
Ni |
|
|||
|
Pb |
The Saxena results
(nuclear track technique) appear strange |
|||
|
Si |
|
|||
|
Ti |
|
|||
|
Click here to get file Xe-Files.zip which contains the compressed version of
all the ORIGIN files for Xe ions |
||||
|
74W ions |
Au |
|
||
|
Click here to get
file W-Files.zip which contains the compressed version of all the ORIGIN
files for W ions |
||||
|
79Au ions |
Al |
The ATIMA calculation reproduces the high energy data perfectly, while
the Hubert and Ziegler tables are slightly low |
||
|
Au |
Jav12 fits the data. |
|||
|
Butane |
|
|||
|
C |
|
|||
|
Cu |
The ATIMA calculation reproduces the high energy data perfectly, while
the Hubert and Ziegler tables are slightly low |
|||
|
Ni |
|
|||
|
Polystyrene |
|
|||
|
Si |
|
|||
|
SiC |
|
|||
|
Click here to get
file Au-Files.zip which contains the compressed version of all the ORIGIN
files for Au ions |
||||
|
82Pb ions |
Al |
|
||
|
Ar |
|
|||
|
Au |
|
|||
|
Be |
The point at 4 MeV/n
is represented by HU90, but not by Z03 |
|||
|
C |
Ziegler appears very
low for light targets, but Hubert fits the data |
|||
|
Ni |
|
|||
|
Sn |
|
|||
|
Pb |
|
|||
|
Ti |
|
|||
|
Xe |
|
|||
|
Zr |
|
|||
|
Click here to
get file Pb-Files.zip which contains the compressed version of all the ORIGIN
files for Pb ions |
||||
|
83Bi ions |
Ag |
The Lindhard-Sörensen curve
follows the high energy data better than SRIM (Z08) |
||
|
Al |
|
|||
|
Au |
|
|||
|
Cu |
The Lindhard-Sörensen
curve follows the high energy data better than SRIM (Z08) |
|||
|
Pb |
|
|||
|
Ta |
|
|||
|
Click here to
get file Bi-Files.zip which contains the compressed version of all the ORIGIN
files for Bi ions |
||||
|
92U ions |
Ag |
|
||
|
Al |
|
|||
|
Ar |
The Barbui curve (Barb10) fits the data
very well |
|||
|
Au |
SRIM is too high
at the maximum for heavy ions in heavy targets, but Hubert fits the data |
|||
|
Be |
|
|||
|
Butane |
|
|||
|
C |
SRIM is too low at the
maximum for heavy ions in light targets, but Hubert fits the data |
|||
|
He |
|
|||
|
Kr |
|
|||
|
Mylar |
|
|||
|
N2 |
|
|||
|
Ne |
|
|||
|
Ni |
|
|||
|
Ru |
|
|||
|
Ti |
|
|||
|
U |
|
|||
|
Xe |
|
|||
|
Zr |
|
|||
|
Click here to get
file U-Files.zip which contains the compressed version of all the ORIGIN
files for U ions |
||||
Computer Programs
In 2001, I have started to
add links to computer programs : to our program MSTAR, and to those of other
authors.
In the article "Empirical
stopping power tables…” by H. Paul and A. Schinner published in Atomic Data and
Nuclear Data Tables (see above), results of MSTAR are presented in tabular
form.
Oscillations
If one plots the stopping power of one substance for various ions at constant, sufficiently low, velocity versus the atomic number of the ion, Z1, one obtains “Z1-oscillations” which correspond to the different atomic structures of the various ions. Similarly, graphs of the stopping power of one ion versus the atomic number of the target atom, Z2, show “Z2-oscillations”. Some examples are shown below.
|
Abscissa Z1 |
Target |
|
Remark |
|
Ag |
|
||
|
Al |
|
||
|
Au |
|
||
|
C |
|
||
|
Abscissa Z2 |
Ion |
|
Remark |
|
Cu |
|
||
|
N |
|
||
|
O |
|
Please let me have your
comments!
Helmut Paul
Institute for Experimental Physics
University of Linz
A-4040 Linz
Austria
Telephone: +43-732-2468-5333
Fax: +43-732-2468-8509
email: helmut.paul(/\t)jku.at
Back to beginning of Stopping Page?
Tables of Optical Oscillator Strengths. The optical oscillator strengths
listed here for Al, Cu,and Au are due to J.M. Fernández-Varea, R. Mayol, D.
Liljequist and F. Salvat, J. Phys.: Condens. Matter 5 (1993) 3593-3610. They
are shown graphically in Fig. 1 of that paper.
The optical oscillator strengths for Si are due to D.Y. Smith et al., see H. Paul, P.L.Grande, D.Y.Smith,
"Optical Oscillator Strengths, Mean Excitation Energy, Shell Corrections
and experimental values for Stopping Power" Nucl. Instrum. Methods
B 267 (2009) 2471.
Last updates:
|
16 Oct 2015 |
Data for Nd, Pm, Sm in
Cd, La in Sn, I in Ag, Cs in Sn (Pas15) |
|
15 Apr 2015 |
Data for H and He ions in
LiNbO3 (BA14b) |
|
16 Mar 2015 |
Data for H and He ions in
Zn and In (Gö14) |
|
25 Oct 2014 |
Data for H and He ions in
TiO2 (Lb96, Li14b); for H ions in H, He and N gas (Cn14) |
|
12 Sep 2014 |
Theory for H in graphite,
polystyrene (deVera14); for H, He, Li and Na in random graphene (Oja14). Data
for C and Si ions in SiO2, and for C, Si and Cu ions in HfO2 (Msi14) |
|
15 May 2014 |
Data for Li, C and O ions
in Mylar, PEEK, polycarbonate (Mik14), for He in HfO2 (Pr14b); theory for H
and He ions in LiF amd SiO2 (Mao 14) |
|
26 Feb 2014 |
Data for Cl, Br, I, Au ions in SiC and SiO2 (Jin14); for U ions in Au
(Ech13), Xe ions in C, Ni, Au (Ech14); H and He ions in hydroxyapatite
(Li14); Au ions in SiC (Jin13); H ions in Pd (MS14); H ions in LiF (Dm13). Theory for H, He
ions in Al, Au and H ions in LiF (Zeb12, Zeb13). |
|
4 Feb 2014 |
Data for Mg, Al, Si in
Formvar, Mg in Ta, Si in Ag, Al in Mylar (Gue14); for C, O, Cl, Br, I ions in
Al2O3, Ta2O5, Si nitrate (Miz13);
for Ne in Au (Pr13b) and H in HfO2 (Pr14). Theoretical curves for
H in Si (Akk14), H in H2O (Sing14), H in water and methane
(Mon14). Data for H in Ge (Rt13) |
|
21 Jan 2014 |
Data for Ne in Au, for Kr
in He, N2, Ne, Kr (Vok13). |
|
16 Sep 2013 |
Data for U in C and Au, H
in SrTiO3, Pd, Pt, Ag; He in Pt, Ag |
|
25 Feb 2013 |
Single points from TEC13
for Cu, I and Au in O2, Si, Hf; Ni and Au in Ni; Ni and Br in Al2O3 and
Ta2O5. C and O in
Ta2O5. C, N, O, Si, Cl ions in silicon nitride |
|
5 Feb 2013 |
Diwan01 fit curve for Cu
in Al; new data by Pr12 for H, He in Au, Pt; by Chk12 for O, F, Si in Mylar.
New data for C in Si; Ni,Cu, I, Au in C; I in Al; He, C, O in GaN and TiO2;
Cl in Ta2O5; H,C in Al2O3; H, He
in Formvar; C in ZrO2 |
|
21 Sep 2012 |
Low energy data for H, He
in Al. Theories: Zeb12 for low energy H, He in Au, for H in H2O by
Francis11. Fits by Jav12 for XeAl, ArC, KrC |
|
17 Feb 2012 |
Fitted curves by Barb10
added. New version of theory by Schiwietz-Grande (SG11). Mylar data by Amm11. |
|
12 Oct 2011 |
New data for H in water,
for low energy H and He in Au and Cu, for He in InN,
and for C and O in Zn. Accurate point for He in Si. |
|
29 Mar 2011 |
New data for H, He, Li,
B, Al, Mg, F, O, Br, I ions in Ag, Al, Au, Be, C, Ni, Si, Formvar, PHB, TiO2,
UF4, ZrO2 by Dm10, Hs10, MD10, Msi10, Sik10, Brd67a and
Brd67b. |
|
20 Sep 2010 |
New graphs for H in He,
Cu, LiF and in condensed H2O, for Li in Si and in polypropylene;
new data for H in fluorides and in halogenated hydrocarbon compounds, and for
Li, C, O in polypropylene added |
|
26 Feb 2010 |
New data for H, He, Be,
B, O, F, Ar, Kr, Au, U ions by Bbi10, BF09, Can09, CL09, Emf09, ZW09 |
|
11 Jan 2010 |
Theoretical curves for
heavy ions added: CasP 4.0 and Arista09 |
|
20 Oct 2009 |
Theoretical curves for H,
He in liquid water, and for H in W, Au, Pb and Bi. Low energy stopping values
for H, He in LiF, KCl, and SiO2. New data for Xe and Y ions, for He, Li and heavy ions in Si, and for Ti in Au added. |
|
23 Jun 2009 |
New data for H ions in
Au, Si and liquid water and for He in Si added |
|
12 Jun 2009 |
Theoretical END curves
for hydrogen ions by Cab00, Cab02, Cab05, Cab08 and tables of optical
oscillator strengths added. |
|
29 Jan 2009 |
Stopping curves from Dent08 and data for Kr and Xe in silicon added. New version of data collection SCSData.zip |
|
6 Nov 2008 |
Data for H in water
vapor, Cl and Si in polymers, Li in Zn, and Au in Ni added |
|
4 Sep 2008 |
Data for heavy ions in
polymers, and for protons in AlF3 added |
|
16 Jun 2008 |
Curve from YC02 for He in
Si added |
|
4 Jun 2008 |
Points due to Vs00 for H
in Pd and Au corrected |
|
26 May 2008 |
File SCSData.zip
reinstalled that had been removed by mistake. |
|
25 Apr 2008 |
Data for U ions by Brn72
added. |
|
8 Feb 2008 |
Threshold effect for H
and He in Au. Li ion data by YuH08. I reduced the
size of the source code by a factor two using wordcleaner by textism. |
|
12 Oct 2007 |
New data for He in Si and
SiC, and for Cu in Au. |
|
13 July 2007 |
Better presentation of gas/solid difference for He ions in gases. Update of *.zip files. |
|
14 May 2007 |
Data by Hs07, Sun07,
YuH07, and Zad07 added (not all in graphs) |
|
7 March 2007 |
Section "Statistical
Analysis" reorganized and beginning of page improved. Curves from Abr07
added to figures. Download of MSTAR corrected. |
|
10 Jan 2007 |
Data by Fer06, Kny06,
MP07, WD06, Zha06c added (not all in graphs) |
|
31 Aug 2006 |
Data by Al04, HA05ab,
Dm06, Per06, MM06, Fet06 added |
|
14 Mar 2006 |
Recent articles added |
|
13 Dec 2005 |
New data for air, H2,
H2O, LiF, SiC, polycarbonate, aluminum oxide and other targets included |
|
17 Oct 2005 |
Included new section with
all the experimental data files |
|
1 Sep 2005 |
PASS curves added to many
graphs |
|
26 Aug 2005 |
New section
"Statistical Analysis" added |
|
23 Jun 2005 |
Many additional data and
corresponding graphs added, especially for H and He ions in (new) compounds |
|
30 May 2005 |
List of compound targets
brought up to date |
|
4 Apr 2005 |
List of compound targets
(for H and He ions) added |
|
28 Nov 2004, 7 Feb 2005 |
Many additional data and new graphs added, especially for H and He ions in air and compounds. Zip files brought up to date |
|
1 Sep 2004 |
Some new graphs and
remarks for H, He, and Li ions |
|
24 Jun 2004 |
Many comments added to
graphs for H and He ions |
|
16 Jun 2004 |
Recent data added for
various ions in Si, and for Au, Pb, and U projectiles |
|
29 May 2004 |
Naglib routine S15AEF in
MSTAR replaced by a local routine (MSTAR 3.12) |
|
22 Apr 2004 |
Recent data added for He
ions in Ag, Ar, Au, Cr, Cu, He, Kr, Mg, Mo, N2, Ne, Ni, O2, Ti, Xe. New
graphs for H ions in Br, Cl, and Graphite. |
|
26 Mar 2004 |
Data added for He ions in
Al, Ar, Be, Bi, C, Co, Cr, Cu, Dy, Fe, Ge, H2, He, Kr, Mo, N2,
Ne, Ni, O2, Pb, Se, Si, Sn, Ta, Ti, V, W, Xe,, Y. Many new graphs.
|
|
11 Mar 2004 |
Data added for H ions in Au, Be, C, Cd, Cr, Cu, H, He, In, N, Ni, Pb, Pd, Sn, Xe, Zr; for He ions in Ag, Au, Si; for Li ions in Cu, Zn; for N ions in Au. Corresponding zip-files updated |
|
22 Dec 2003 |
Data added for Li ions. New or updated graphs for H ions in H2, He, Be, N2, O2, Mg, Al, Ti, V, Fe, Co, Ni, Cu, Ge, Mo, Ag, Sn, Sb, Ta, Pt, Au, Pb, and Bi targets. New list of data files for H ions. |
|
14 Nov 2003 |
New graphs added for H,
Li, C, Mg, and Ag ions; zip files updated, Ag-Files.zip new. |
|
9 Jul 2003 |
New graphs for Li, O, Ti,
Nb, Xe, W, Au, Pb and U ions |
|
26 Jun 2003 |
*.zip files containing ORIGIN files updated. New section ?Oscillations? added |
|
28 May 2003 |
Graphs for H ions with
gas-solid effect. Some data by Whl02 (in Si) added; also LiX02b |
|
8 Apr 2003 |
New version 3.11 of MSTAR
also calculates B, Zr, and Ta targets |
|
3 Apr 2003 |
Graphs for new targets:
B, Ta, Zr |
|
1 Apr 2003 |
Many new targets for Kr
ions added |
|
13 Feb 2003 |
Many compounds added |
|
06 Feb 2003 |
Several Z03 curves added.
Universal plots renewed. |
|
24 Jan 2003 |
*.zip files containing
ORIGIN files updated |
|
02 Dec 2002 |
New version (3.00) of
MSTAR, based on the new data, and nickel target data |
|
04 Sep 2002 |
Added new data by Ala01, Ala02, Ara02, Aze02, Hak02, Kha01, LiX02, Pen01, Shr02, Trz02, Whl02a, Zha02b. Redundant data by Hv68 removed. |
|
12 Mar 2002 |
Mylar, Kapton and
graphite graphs added. Also curves by Northcliffe and Geant4 |
|
21 Nov 2001 |
Structure of page reorganised. Data files up to 36Kr ions completed. Some graphs for Xe and U ions added. |
|
17 Oct 2001 |
Some graphs corrected,
Mylar data added, Hiraoka and MSTAR curves added, tables updated |
|
15 Oct 2001 |
Links to computer
programs added |
|
19 Jul 2001 |
*.zip files updated, some new. Universal curves updated |
|
27 Jun 2001 |
Data for K, Ar, Ca, Sc,
Ti ions added |
|
9 May 2001 |
An78 data (Li ions)
added, Bi90 data (O ions) removed, LuX00 data (O and F ions) added |
|
13 Nov 2000 |
Universal curves added; Li
ions on Al, C ,Cu ,H2 ,He ,Ne ,Ni; B on Al, C; O on C, Ni |
|
6 Sep 2000 |
C, N, O on carbon; O on
aluminum |
|
30 May 2000 |
New graphs for gas
targets. New data by Hu99, Ang00, Hu00, She00 for solid targets |
|
6 Apr 2000 |
Improved graphs for C, O,
Ar projectiles (new Ziegler and GS curves), etc. |
|
15 Mar 2000 |
New/improved graphs: H on
Al, C, Gd, Pt, Ta, W; C on Ag, Au; S on Ag, H, Kr;Cl on Ar, H |
|
10 Jan 2000 |
Additional points by Si84
for H on Al, Gd, Pt, Ta, and W |
|
21 Dec 1999 |
New graphs: H on Gd,Pt; B on Ag,Au; Mg on Ag,Al. Others improved. |
|
24 Nov 1999 |
Improved layout, and some
new data. |
|
18 Oct 1999 |
Correction: Points of
Po60 for O projectiles had been plotted at wrong energies. |